


Marketing efforts lie in that liminal space between the abstraction of creativity and the concreteness of data. You need to think out of the box, but also be able to back everything up with numbers.
CMOs and Marketing Directors know marketing is important. But actually proving its value is another thing entirely. The problem is two-fold: a lack of solid data and/or inability to translate it into actionable insights.
The best way to fix this is to tackle it from the ground up. You need to look into how you get your data and your current analysis techniques.
In this guide:
- Key Takeaways
- Step 1: Conduct an Audit
- Step 2: Turn Your Audit Into a Gap Analysis
- Step 3: Translate Your Business Objectives Into the Right Metrics
- Step 4: Track the Metrics Matched to Your Business Model
- Step 5: Adjust Your Conversion Events and Cycle Length by Industry
- Step 6: Choose an Attribution Model You Can Maintain
- Step 7: Get Marketing and Leadership Aligned on the Same Numbers
- Step 8: Build a Review Cadence That Turns Metrics Into Decisions
- Step 9: Calculate Your Profit-Based Marketing ROI
- Step 10: Know When It’s Time to Bring in Outside Support
- Conclusion
Key Takeaways
- Audit before you optimize. A full measurement audit, consolidated into a prioritized gap list, shows what to keep, fix, or build.
- Give every metric a defined job. Business objectives should cascade into a primary KPI, leading indicator, and guardrail metric tailored to your business model.
- Choose attribution you can sustain. A simple, repeatable model beats a sophisticated one your team can’t maintain.
- Align and review consistently. Shared metric definitions with finance and a weekly, monthly, and quarterly cadence turn data into decisions.
- Measure ROI on profit. Leadership judges marketing on margin-adjusted return against fully loaded cost.
Step 1: Conduct an Audit
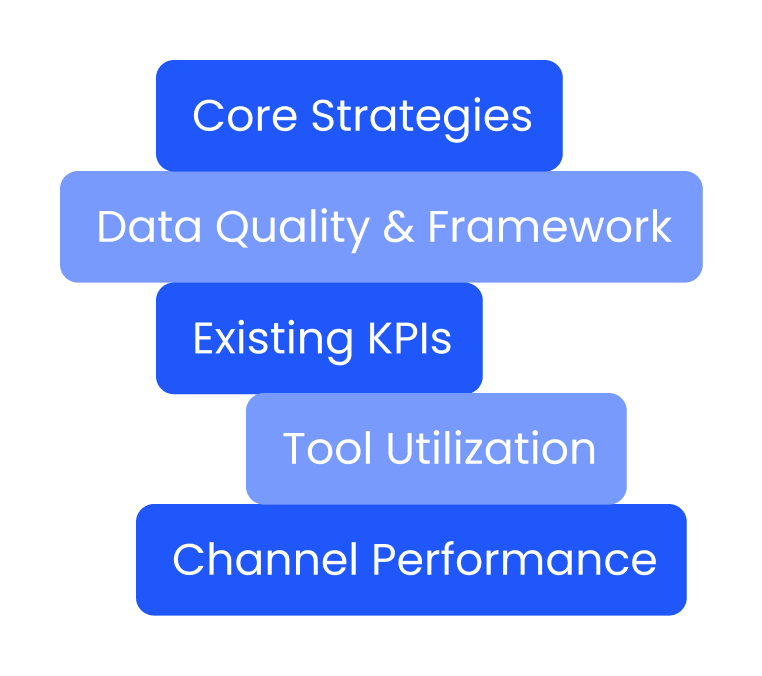
Your first step should be to take stock of your marketing measurement efforts as a whole. What metrics are you using to measure the success of marketing campaigns? What type of data are you collecting and how are you analyzing it?
Core Strategies
Before you can know what needs to change, you need to have a full overview of your workflow. Start by cataloguing every active marketing strategy and channels currently running.
Ideally, you would’ve built your marketing strategies around specific goals. The success of different goals will naturally be measured with different metrics. On top of that, each channel will provide different amounts and types of data.
Make sure to create a unified document outlining your strategies, their goals, and what channels you’re using for them. This will give you a clear overview you can use to spot weak points and opportunities for improvement. Some problems might become obvious even during this first step.
Data Quality and Framework Assessment
When it comes to marketing measurement, it’s easy to lose sight of the forest for the trees. You’re struggling to make heads or tails of the tons of data you’re collecting, but is the data even accurate?
Make sure the pipelines you’ve built are firing correctly: that CRM lead sources match campaign UTM parameters, for example. This should cover all tracking implementations and platform integrations.
Check that concrete, verifiable metrics, such as revenue and sales metrics, match up across financial dashboards, platforms, and CRMs.
Ensure the reports you get reflect data in real time or at least in a timely manner to support agile decision making.
You can’t have data-empowered marketing without good data.
Existing KPIs
There’s a difference in how marketing experts and CMOs view campaign metrics and what leadership considers actionable data.
So, how to measure marketing success precisely in a way leadership will understand? Firstly, draw up a list of the KPIs you’re currently tracking. Compare that to what your higher-ups will actually be interested in and deem important and find the common ground. If you can’t find sufficient overlap, you’re tracking the wrong metrics.
In effect, you need to be thinking of this as an internal marketing campaign that targets leadership.
Tool Utilization
The amount of tools available to marketers is seemingly endless. It’s easy to keep using certain data tracking platforms out of habit, or keep jumping onto newer, shinier ones.
It’s time to clean house. Take inventory of every piece of software or platform you’re currently using to collect marketing data. Note who has access to it and the last time it was used, alongside its monthly cost.
This is where we need to be intentional with our focus – less is more.
Channel Performance
Every channel needs a different approach and serves a different purpose. The true art of marketing is knowing where to focus your efforts.
To get a handle on the situation, you need to pull recent data on spend, leads or transactions generated, and CPA for each marketing channel. Where possible, use the same time period and attribution methodology across channels so you can accurately compare them.
This will enable you to identify which channels are driving the most growth and gauge their efficiency. After which you’ll have a baseline for evaluating performance, allocating budget and identifying opportunities for improvement.
Step 2: Turn Your Audit Into a Gap Analysis
With your audit complete, it’s time to move onto the fun stuff: gap analysis.
Approach this by first consolidating the audit areas into a single, prioritized list of gaps. Some common issues include:
- Strategies without a clear owner
- Data quality issues
- KPI with no corresponding action
- Underused or redundant tools
- Channels without a performance baseline.
Categorize each gap by impact and urgency to create a reference point for your next steps. You can then determine which KPIs and processes are already working and which need to be reworked and rebuilt from scratch.
Step 3: Translate Your Business Objectives Into the Right Metrics
The marketing department doesn’t exist in isolation. Business objectives are put forth from the top and marketers have to work towards them. In light of those goals, your job is to determine which metrics matter.
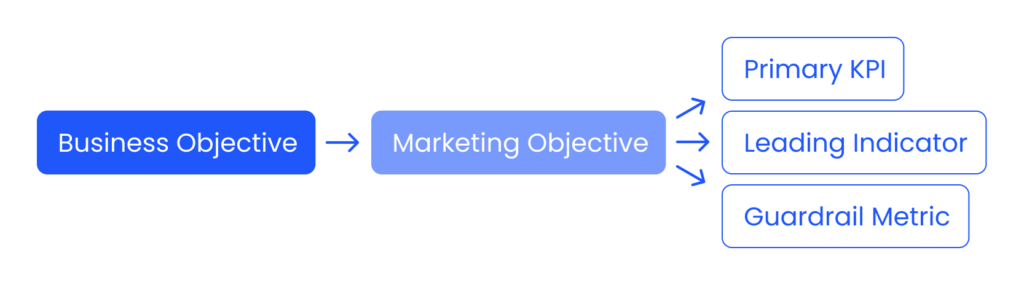
Let’s say leadership is looking to drive revenue growth. They’re not going to be moved by increased numbers of followers unless it’s clear how they translate into more sales or leads. Even if revenue has increased, do you have the data to connect it to the efforts of the marketing team?
Be prepared to defend your successes by setting your KPIs based on your company’s business objectives from the start. Remember, you need to show measurable results over vanity metrics. You can see some examples in the table below.
Metrics to Measure the Success of Your Marketing Campaign
Metric Role | Credit Union | SaaS | eCommerce |
Objective (Macro Business Impact) | Increase loan revenue by 15% | Increase net new ARR by 20% | Increase total revenue by 25% |
Primary KPI (Volume Control) | Application volume | Sales Qualified Lead (SQL) volume | Checkout / Shopping Cart initializations |
Leading Indicator (Quality Control) | Conversion rate (Application to Funded Loan) | Win rate (SQL to Closed-Won)) | Cart Conversion Rate (Cart to completed purchase) |
Guardrail Metric (Economic Control) | CAC (Cost per Funded Loan) | CAC Payback Period | Marketing Efficiency Ratio (MER) |
Step 4: Track the Metrics Matched to Your Business Model
The same metric category can be tracked and interpreted in a completely different way depending on your business model. This can be difficult to navigate and lead to a variety of blind spots. It’s crucial you know exactly what you want to get from your data, so you can set concrete, measurable goals.
The main marketing measurement categories are volume control, quality control, and economic control. These categories can look completely different for, say, an asset-based credit union, a lead-based B2B, and a transactional e-commerce business.
The table below illustrates these differences more clearly.
Business Model | Specific Metric | What It Measures | Common Pitfalls |
Credit Union | Application Volume | The raw number of loan applications initiated via digital or branch channels that are attributed to marketing efforts. | Attribution Blindness: Failing to track members who see a digital ad but apply in-person at a physical branch, resulting under-reported marketing impact. |
Application-to-Funded Rate | The percentage of submitted loan applications that successfully pass underwriting and result in a disbursed loan. | System Disconnect: The Loan Origination System (LOS) failing to sync data back to marketing automation tools, leaving marketing blind to which leads actually closed. | |
CAC per Funded Loan | The total marketing acquisition spend divided by the total number of finalized, revenue-generating loans. | The Blended Illusion: Averaging all loan types together. A mortgage costs significantly more to acquire than a used auto loan; a single blended CAC hides unprofitable campaigns. | |
SaaS (B2B) | SQL Volume | The number of marketing-generated leads that meet the strict criteria to be accepted by the sales team as active pipeline opportunities. | Lead Inflation: Relaxing the definition of an SQL to hit volume targets, which floods the sales team with low-intent or bad-fit prospects. |
SQL-to-Closed-Won Win Rate | The conversion percentage of those accepted marketing leads that successfully close as paying contract customers. | Lag Time Distortion: In long sales cycles (3–9 months), current month wins are tied to leads from quarters ago. Measuring them concurrently creates highly inaccurate data. | |
CAC Payback Period | The exact number of months of subscription revenue it takes a new customer to pay back the cost it took to acquire them. | Gross Margin Omission: Calculating payback based on top-line revenue rather than gross profit (revenue minus the cost of serving the customer), making payback look artificially fast. | |
eCommerce | Checkout Initializations | The total number of users who add items to their digital shopping cart and explicitly begin the checkout process. | Bot Traffic: Failing to filter out automated scrapers or bots that add items to carts, which creates false spikes in perceived intent. |
Cart Conversion Rate | The percentage of those initiated checkouts that successfully cross the finish line to become completed, paid transactions. | Promo Codes: Flash sales or deep discount codes artificially inflating conversion rates while masking a severe drop in standard unit profitability. | |
Marketing Efficiency Ratio (MER) | Total online revenue divided by total marketing ad spend across all channels, measuring macro ecosystem health. | Platform Data Reliance: Relying entirely on ad platform dashboards (like Meta or Google Ads) which over-report their own success due to overlapping attribution windows. |
You need to select the right key performance indicators (KPI) for your industry and business model.
Step 5: Adjust Your Conversion Events and Cycle Length by Industry
Some conversion events are straightforward, such as a completed purchase, but they can vary greatly by industry. Put shortly, a meaningful conversion event is one that aligns with your business goals which, of course, will be different for every organization.
Your industry will define the typical length of the purchase cycle. While eCommerce might move quickly and expect impulsive behaviour from clients, SaaS companies can spend months building trust with potential clients. So the marketer working in a Saas company will be tracking key performance indicators (KPI) very differently from the one in eCommerce.
It’s important you’re clear on what constitutes a meaningful conversion event for your organization and how long the purchase cycle is. These parameters will give you a solid framework for marketing measurement and defining success.
You can see a comparison between the Credit Union, SaaS, and eCommerce industries in the following table.
Metric Attribute | Credit Union | SaaS (B2B) | eCommerce |
Primary Conversion Event | Application started or advisor consultation booked. | Demo request or trial signup. | Completed purchase. |
Typical Cycle Length | Weeks to months; heavily trust and compliance-driven. | 30 to 90-plus days; multi-stakeholder evaluation. | Single session to a few days; highly impulsive or direct. |
Common Measurement Pitfall | Compliance-heavy content misread as low-value awareness when it’s actually a conversion driver. | Trial signups treated as a revenue signal before they qualify into a paid conversion. | Blended ROAS masking which channels are actually profitable; returns/refunds are not factored in. |
Step 6: Choose an Attribution Model You Can Maintain
Be careful to not set yourself up for failure by choosing an attribution model you can’t keep up with. Data is useless if you don’t have the bandwidth or expertise to analyze it.
You might be tempted to adopt a more sophisticated reporting model without taking into account it was designed for a bigger enterprise. Bigger companies are dealing with high data volume and complex customer journeys, but they also have a dedicated analytics team. Be mindful of how much your team can handle.
No attribution model is perfect. Choose the most useful model your team can consistently support with the data, tools, and resources available today. You can also start with a simpler approach and add complexity as your data volume and analytical capabilities grow.
What you should be looking for is a repeatable model that enables your team to make better budget and channel decisions.
Model | Best For | What It Misses | Consideration for a Lean Team |
Last-Click | Short sales cycles or single-session purchases | Upper-funnel and consideration-stage activity | Simplest to maintain, may undercount awareness efforts |
Position-Based (U-Shaped) | Multi-touch B2B or higher-ticket e-commerce journeys | Nuance in the middle of the journey | Available natively in tools like HubSpot and GA4 |
Time-Decay | Cycles of roughly 30 to 90 days | Early awareness contribution | Reasonable alternative when cycles run longer |
Marketing Mix Modeling | Larger budgets with meaningful offline spend | Real-time responsiveness, needs significant historical data | Typically out of reach without dedicated analytics resourcing |
Step 7: Get Marketing and Leadership Aligned on the Same Numbers
Ideally, you want to get everyone on the same page in terms of how you define success very early on. What seems like a no-brainer for Marketing could be deemed superfluous by Finance.
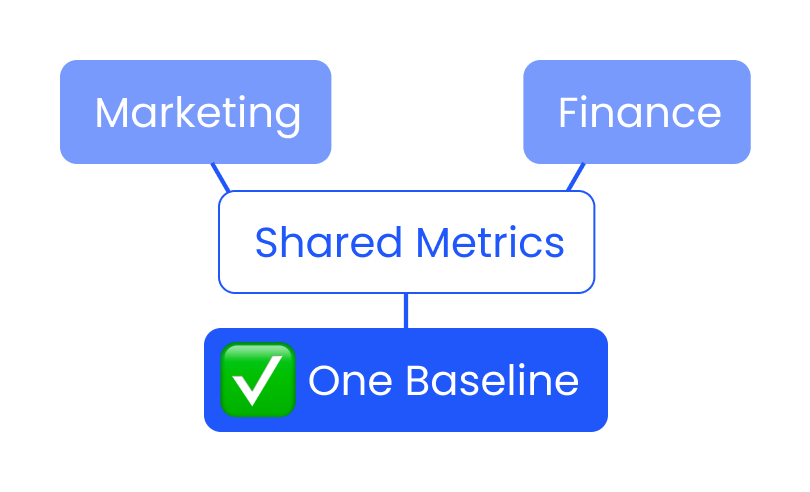
You can avoid a lot of future headaches by agreeing on clearly defined shared metrics that both teams reference consistently in review reports. Establish how it’s calculated, where the data comes from, and who owns it so everyone is working from the same baseline.
Step 8: Build a Review Cadence That Turns Metrics Into Decisions
At the end of the day, your goal is not to just collect metrics and organize them neatly. Information is useless if we don’t act on it, which can’t happen without regular check-ins.
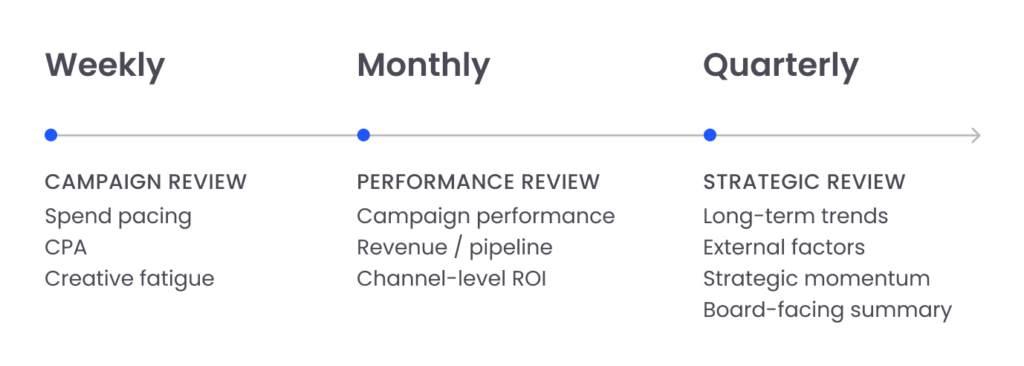
You’ll want to set up a three-tier review cadence with weekly check-ins, monthly performance reviews, and a quarterly strategic review.
Weekly Campaign Check-Ins
This is where you focus on metrics that change quickly so you can seize opportunities and eliminate potential issues.
Check whether campaigns are spending as planned and what the CPA is currently. See if ad performance is declining as audiences see the same creative repeatedly. This is also a great opportunity to acknowledge successes and encourage your team to keep up the good work.
This review is typically owned by the channel manager, performance marketer, or marketing operations lead, with key findings escalated to leadership when performance requires a budget or strategy change.
Monthly Performance Review
Monthly performance reviews are a little more big picture focused but still cover some fast-paced metrics. A 30-day period is great for measuring campaign performance, noticing revenue or pipeline trends, and reviewing channel-level ROI. This is usually enough time to be able to tell which strategies are working and what needs to be re-adjusted.
The monthly review should be impactful for budget conversations. Financial decisions need to be backed by the right metrics, which you should now have access to. Timely adjustments to your strategy will greatly improve marketing performance in the long run.
Quarterly Strategic Review
Trends, consumer behavior, and external factors like the economy or policy shifts can all change quickly. A quarterly review aims to track longer-term trend lines across the year to separate genuine momentum from short-term noise.
This is also when marketing’s performance gets weighed against every other department’s, ensuring the organization stays aligned. Expect the quarter to culminate in a board-facing summary: a concise, data-backed account of what worked, what didn’t, and where strategy is headed next.
Step 9: Calculate Your Profit-Based Marketing ROI
You might be used to measuring marketing performance by tracking the number of sales or leads you attracted through your campaigns and overall efforts. However, this is not necessarily how leadership thinks about it and it’s them you need to convince your strategies are effective.
While you’re focused on the results, your higher-ups are also sensitive to the costs. In other words, you could be focusing on top-line revenue, when what matters is margin-adjusted economic profit.
So how to measure marketing ROI in a profit-based manner? Follow this formula:
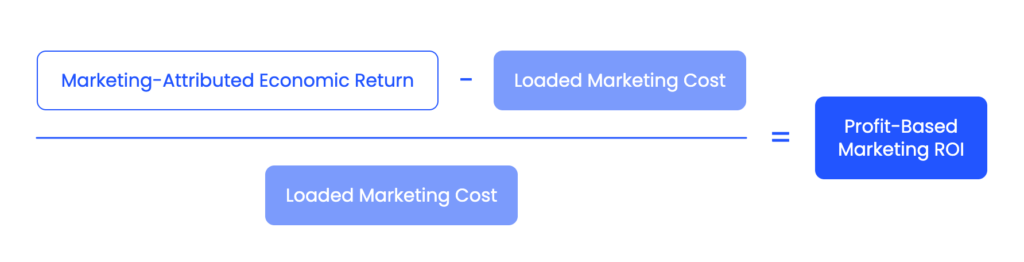
The cleanest approach is to take the marketing-attributed economic return and subtract the loaded marketing cost. Divide that number by the loaded marketing cost and you’ll end up with the profit-based marketing ROI.
Metric Attribute | Credit Union | SaaS (B2B) | eCommerce |
Economic Return (Numerator Value) | Interest income and attributable loan fees, less allocated funding costs and credit-loss expense. | Gross profit attributable to marketing-influenced closed-won customers (annualized ARR × gross margin %). | Gross profit from marketing-attributable purchases (net sales minus COGS and applicable transaction fees). |
Loaded Marketing Cost (Denominator Value) | Total campaign ad spend, localized acquisition tools, and marketing team payroll/overhead. | Total campaign ad spend, content creation vendors, pipeline technology, and marketing team payroll/overhead. | Total digital ad spend, agency retainers, creative production, marketing technology, and marketing team payroll/overhead. |
Profit-Based ROI Formula | (Marketing-attributed economic return minus loaded marketing cost) divided by loaded marketing cost. | (Marketing-influenced gross profit dollars minus loaded marketing cost) divided by loaded marketing cost. | (Marketing-attributable gross profit dollars minus loaded marketing cost) divided by loaded marketing cost. |
Common Financial Pitfall | Using the total funded loan principal amount instead of the actual economic return from interest, fees, funding costs, and credit losses. | Using top-line contract value or ARR instead of annualized gross profit, overstating the economic return. | Failing to account for discounts, returns/refunds, COGS, and applicable transaction costs, which inflates the true return. |

Step 10: Know When It’s Time to Bring in Outside Support
One pitfall of having a dedicated in-house marketing team is that it’s easy to forget outside support is even an option. Your audit can illuminate real gaps and plenty of ideas for improving efficiency, but there’s only so much a small team can take on.
Most mid-market marketers were hired for their creativity and for specific, focused roles. Can we reasonably expect them to single-handedly run strategy, execute across every channel, and build the reporting leadership expects, all at once?
When the gap of what you know your organization needs and what it has bandwidth for becomes obvious, it’s time for backup. Hiring an agency to help strategize and implement a marketing measurement plan is an easy way to alleviate the pressure on you and your team.
How Session Interactive Helps Mid-Market Teams Improve Marketing Performance
Knowing what to measure is only half the battle; acting on it at scale is where many mid-market teams hit a wall.
Session Interactive closes that gap, pairing robust analytics with cross-channel marketing solutions and seamless integration across your existing stack. This way, strategy, execution, and reporting don’t fall solely on an already-stretched team.
Ready to see what’s possible? Get in touch and let’s talk.
For over 15 years, Session Interactive has helped mid-marketing organizations across a variety of industries prove their marketing efforts. From auditing analytics and tracking to defining the KPIs that align with business goals, we provide marketing teams with measurement frameworks that leadership trust. We combine seasoned digital marketing expertise across a variety of services so strategy, execution, and reporting all work towards the same goals.
Ready to start measuring what matters?